The Best Candlestick Pattern Indicator for MT4

Finally, a proper customizable candlestick pattern indicator that scans and filters high-quality single, double and triple candlestick patterns.

So when it comes to candlestick patterns and price action, there is no definitive way to measure the accuracy, reliability and performance of each candlestick reversal pattern. That really frustrates me because there are so many candlestick patterns which in theory makes a lot of sense – but no one has ever created a definitive study on how effective they are and to what degree they are effective (sure, that is a nice reversal pattern and price has reversed – but how often would this work and for each reversal it makes – by how many pips?)

With this frustration boiling in me, I decided to create the definitive study into candlestick patterns and price action effectiveness. This required me, of course, to create what I can say with a high degree of confidence – the most comprehensive and accurate price action and candlestick pattern indicator.

What is wrong with the candlestick pattern indicators out there?

Long story short: They are terrible.

Honestly, there are so many price action candlestick pattern indicators out there that give you so many terrible signals. Just because one candlestick is bigger than the other, doesn’t make it an engulfing candle dude.. *rolls eyes*. The same way just because you see a doji, you shouldn’t start screaming a “GRAVESTONE DOJI” alert *rolls eyes even further back*.

The problem with many of these indicators is that they don’t factor in the importance of the nuances when it comes to determining candlestick patterns. For example, a candlestick reversal pattern should usually only come after a sustained period of rise in price (for a bearish reversal) or a sustained period of drop in price (for a bullish reversal), right? Don’t show me a candlestick reversal pattern when price has been flat for the past 30 bars – it means nothing and even worse, can be detrimental if we acted on it.

It is important to a sustained drop/rise before a reversal pattern as seen in the examples below:

sustained drop before a bullish reversal pattern
There is a sustained drop before we're supposed to see a bullish reversal.
bearish reversal condition
There needs to be a sustained period of prices rising before a bearish reversal pattern can be effective.

So as seen in the examples above, the period “leading” up to the candlestick pattern is as important as the candlestick pattern itself. As that sets the ground for how effective a reversal we can expect.

Below are 2 of the “top” candlestick pattern indicators out there. Look at the number of false and bad candlestick pattern signals they are giving out.

Bad Example #1:

In the example below, we can see that there is literally a candlestick pattern every 3 candles. Imagine trading every single one of these candlestick patterns – your account would be blown up faster than Usain Bolt’s 100m record.

Candlestick pattern indicator for MT4 - bad example 1
Bad Candlestick Pattern Indicator - there's literally a pattern every 3 bars.

Bad Example #2:

In this example below, on the same chart, we have the number 2 top-rated candlestick pattern indicator out there. It filters a bit more of the candlestick patterns out there but still leads to many questionable candlestick patterns – especially the shooting star candlestick patterns towards the right of the chart. Imagine trading every single one of those shooting star formations – you’ll definitely be seeing.. stars.. (ha-ha).

Candlestick pattern indicator for MT4 - bad example 2
Another bad example of a candlestick pattern indicator.

As seen in the above 2 examples – quantity does not mean quality. These candlestick patterns are just on one forex pair – EUR/GBP. If you multiply this across 30+ tradeable forex pairs, you’ll be trading 300 different positions. 

The trick, my friend, is in the filtering. 

There are enough currency pairs out there such that even if you received one good quality candlestick pattern signal a day on each pair, that’s over 30 good trading signals. Here’s how we filter the perfect candlestick pattern with our indicator.

Good Example #1:

Good candlestick pattern indicator for MT4
We can see how our 3 consecutive shooting star candlestick patterns resulted in brilliant reversals.

As you can see from the above example, applying something like a bullish/bearish reversal condition can filter out a lot of bad and false candlestick reversal patterns. We will touch on this in the next section.

So Mr Wise Guy, if you're so smart, what makes your indicator different?

I’m glad you asked! (even though I know you didn’t). So when building this indicator, there are many things I took into consideration to determine how I can properly identify candlesticks (and from there, properly assess their reliability, accuracy and performance). 

Here are the variables that can be edited along with an explanation of why they are included. The indicator reads from a separate csv file which you can edit (like the picture below) – this is because we made it so detailed and customizable that we couldn’t code the number of variables directly into MT4 itself. We needed to get it to read off a separate file (and the results are glorious!)

For anyone who wants to see the entire google sheet, you can head over to here: Candlestick Pattern Indicator Calculations. I occasionally update the list of pattern calculations there and for anyone who has the indicator, I just started a private telegram group to get everyone together to discuss different setups.

List of all editable fields in the candlestick pattern indicator
List of all editable fields in the candlestick pattern indicator. Yes, it's in a csv file because there's too many that even the MT4 Indicator is not able to handle it.

How do i get this indicator?

Free version works on AUDUSD, GBPUSD, USDJPY.
(Discount code in email too!)

Table of Contents

I'm sorry - this is going to be a super long article as we need to cover so much. Please bear with me as we dig deep into what is to be the most comprehensive candlestick indicator.

Table of Contents

Candlestick Indicator Settings

The important ones you need to know about

Bullish / Bearish Reversal Condition

Now, finding a bearish engulfing candlestick pattern when price is in the middle of a range is very different than finding a bearish engulfing candle when price is at an all-time high – right?

So this variable allows you to determine what the condition has to be leading up to the reversal. You will be able to adjust:

  • Number of bars before the candlestick reversal pattern
  • Total distance in pips travelled by these number of bars in the form of ATR

Why do we use ATR? 

Because ATR means Average True Range which is the most accurate representation of the volatility of price during a period of time. During really volatile times, ATR is larger and that more accurately defines what a big “move” is before a candlestick reversal. This is better than using a standard “X amount of pips” as during different sessions (and across different currency pairs), 50 pips might seem like a big drop on EUR/USD but it is nothing on GBP/CAD.
 
So, what values do we recommend for this? Let’s look at a couple of examples below.
 

Candlesticks: 30 | ATR Multiplier: 5

If you’re looking for basic reversals, this would be the most ideal setting to use. 30 candlesticks would give you just about enough distance and is not too short (who wants to play a reversal after 5 candlesticks?) and not too long (300 candlestick reversal?). An ATR Multiplier of 5 means that the total distance travelled by these 30 candlesticks need to be at least ATR*5. So if ATR value at that point of time is 10, then it needs to be 50 pips. This is how it would look like on the indicator – there is a blue box on the left of the pattern showing it:

ATR Calculation before a bullish candlestick pattern
This blue box shows how before the bullish hammer candlestick pattern occurs, there is 30 bars to the left of it that has a combined height of at least 5x ATR. This ensures that the move leading up to the reversal candlestick is nice and significant - only in such environment can a candlestick pattern work well.

Candlesticks: 100 | ATR Multiplier: 10

If you’re looking for major reversals, this would be an ideal setting to use. 100 bars before the candlestick pattern with an ATR Multiplier of 10 usually means that there is a sustained period of drop/rise which sets the stage perfectly for a candlestick reversal pattern.

A candlestick pattern with 10x ATR

1 Candlestick Reversal Patterns

Most people think that all candlesticks are the same – but that is not true. We need to properly define a candlestick and that is done through a meticulous process of defining every single element in the candlestick.

ATR Multiplier of candle:

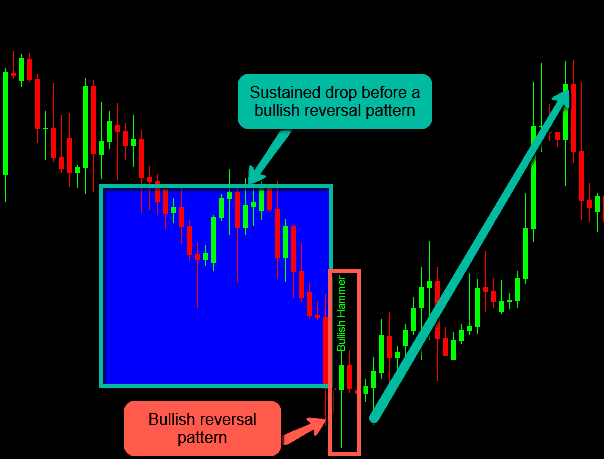
First and foremost – yes you guessed right, we need to define what is the minimum height of this candle in the form of ATR. This is once again because just because the body of a candle is at the top half of the candle, doesn’t make it a hammer reversal pattern. If it was a super tiny candle, would you really consider it a proper candlestick reversal?

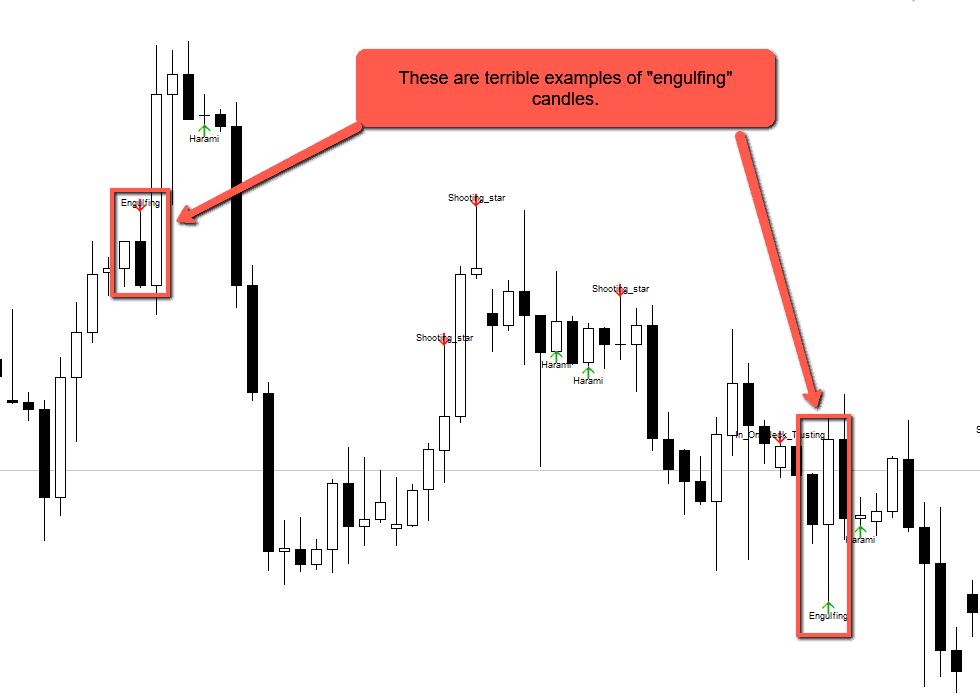
See this example below where some (not going to mention names) candlestick indicators show this as a valid hammer reversal pattern.. ridiculous right?!

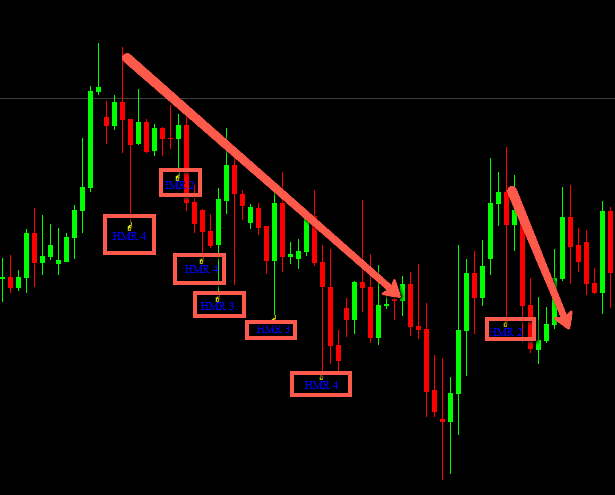
Bad Example #1 for Bullish Hammer Reversals:

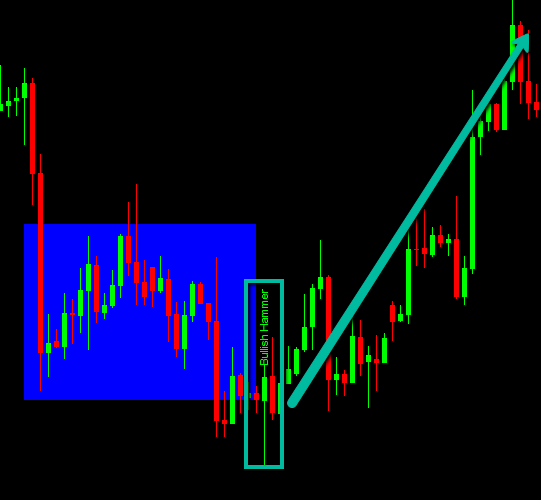
In the picture below, you can see that the bullish hammer reversals are not effective because some of them are just way too small compared to the prevailing move of the market. If you traded every single one of these “hammers”, your account would take a huge hammering (ha-ha).

Imagine this: if you have a massive huge nail that you need to hammer – would you use a tiny hammer or a large hammer? A large hammer, of course! So to properly define this, we need to consider to apply an ATR multiplier to the candlestick pattern otherwise you’ll get tiny useless hammer patterns like below:

bullish hammer candlestick pattern - bad example
Bad example of bullish hammer candlestick reversals.

Now you can see that it’s important to consider the size of the candlestick reversal. On top of that, you have to consider if the prevailing drop is big enough for there to be a reversal.

Bad Example #2 for Bullish Hammer Reversals:

In this next example, there are a few decent examples of a bullish candlestick reversal, but for every 1 good example, there are 3 bad examples. The problem is similar to the first example – there isn’t an ATR multiplier for each candle nor is there a prevailing bullish reversal condition which is why you will notice some bullish hammer reversal patterns appear at the top of a move.

candlestick pattern indicator - bad example for hammer
Another bad example of the hammer reversal pattern we're looking for.

The result is a whole bunch of candlestick patterns scattered across your chart. Hardly any of these would be useful to you and most could in fact mislead you quite a bit.

So at this point, you should be thinking: How would the ATR candle multiplier help in this case? Let’s explore this along with some other parameters to fine-tune our bullish hammer candlestick reversal pattern below.

The Bullish Hammer Candlestick Reversal Pattern

First and foremost, let’s understand how the perfect bullish hammer candlestick pattern looks like. Here is one which our indicator found (and we find many like these).

candlestick pattern indicator - good example of a bullish hammer candlestick pattern
This is our indicator picking up a perfect bullish hammer candlestick pattern. Notice the blue area before it - that is the "drop" required before a reversal pattern is identified.

Now that we have defined the perfect bullish hammer candlestick pattern, let’s start to breakdown all the parameters and calculations needed to identify it on a chart.

ATR Multiplier for Bullish Hammer Candlestick Pattern

So, by default, we have this setting for our ATR Multiplier:

  • ATR Period = 15
  • ATR Multiplier = 1

What does this mean? We take the past 15 bars as a gauge for our ATR Multiplier so that it’s sensitive enough without being overly sensitive to the recent move.

An ATR Multiplier of 1 means that the bullish hammer candlestick pattern that occurs would be at least an average size of the recent past 15 candles.

Percentage of the body relative to the entire candlestick body

Next, we need to determine how big the body is in relation to the entire candlestick. This is important because the head of the hammer needs to be of a decent size. If it’s too tiny, it will miss the nail it wants to hit (just imagine this). If it’s too big, it’s more like a baseball bat instead of a hammer.

  • Minimum candlestick body size: 20%
  • Maximum candlestick body size: 40%
  • Top 40% of candlestick

Notice that this “Bullish hammer reversal” candlestick pattern usually happens at the bottom of a downtrend signaling that price might bounce? So in this case, we have to pick “bullish reversal” as the condition of the candlestick. It’s worth noting that the body of the candle (in relation to the entire candle) needs to be a minimum of 20% and maximum of 40%.

So these are the values you use:

  • Condition: Bullish Reversal
  • Candlestick pattern: bullish (means close is above open, like a bullish green candle)
  • Minimum ATR multiplier of candle: 1.0
  • Minimum candlestick body size: 20%
  • Maximum candlestick body size: 40%
  • Top: 40% of candle
How does this look like after we have set out these parameters?
Perfect example of how our candlestick pattern indicator identified a bullish hammer reversal.

Super awesome, right?!

Hanging Man reversal candlestick pattern (bearish)

This is how a hanging man reversal candlestick pattern looks like. If a “hammer” if found at the top of a trend, it is not called a hammer, it is called a “Hanging man”. Here is our indicator finding the perfect hammer reversal setup.

candlestick pattern indicator - good example of a bearish hanging man pattern 2
A good example of how our candlestick pattern indicator identified a perfect bearish hanging man pattern that resulted in a nice drop.

So we know that this happens after a rise (so we choose the bearish reversal condition we discussed earlier).

Now, ideally, the bigger a candlestick pattern, the better it performs. So we’re looking for this candlestick pattern to have a minimum ATR of 1.0.

The candle needs to ideally be a bearish candle (you know, red bearish candle vs green bullish candle). The body of the candlestick should be at a minimum 20% of the body and at most 40% (not more than half of the candle). This body needs to be in the top 40% of the candle to form a really nice hammer candlestick pattern.

So these are the values you use:

  • Condition: Bearish Reversal
  • Candlestick pattern: bearish (means close is below open, like a bearish red candle)
  • Minimum ATR multiplier of candle: 1.0
  • Minimum candlestick body size: 20%
  • Maximum candlestick body size: 40%
  • Top: 40% of candle
You could also flip the position of the body to the bottom 40% of the candle and that would result in brilliant shooting star candlestick patterns. Here’s an example of how that looks like:
Great example of the shooting star candlestick pattern

Reduce the size of the body a bit and you get a gravestone Doji like in the picture below:

A great example of how our candlestick indicator identified the perfect bearish gravestone doji

Notice that these hanging man, shooting star and gravestone doji candlestick patterns are at the top of a nice bullish trend forecasting the perfect reversal? This is only made possible because we have defined the “bearish reversal condition” mentioned earlier, where we only scan for such bearish reversal candlestick patterns after a decent uptrend.

The Best Single Candlestick Patterns

The variables you can edit here will form the basis of all the other 1-candlestick reversal patterns. Here are some of the other 1 candlestick reversal patterns you can consider (and which have been placed into the candlestick indicator for you to use):

Bullish Reversal 1 Candlestick Patterns

  • Hammer (bullish/bearish candle)
  • Inverter Hammer (bullish/bearish candle)
  • Dragonfly Doji
  • Long Legged Doji

Bearish Reversal 1 Candlestick Patterns

  • Hanging Man (bullish/bearish candle)
  • Shooting Star (bullish/bearish candle)
  • Gravestone Doji
  • Long Legged Doji

Now that we have dived deep into what 1 candlestick reversal patterns are, the next thing we should do is to look at 2 candlesticks reversal patterns. These candlestick reversal patterns are a bit trickier as it’s not just about the single candle that is being formed, but how a very specific combination of both (with very specific candlestick requirements) would trigger a nice reversal pattern.

The bullish/bearish reversal conditions we mentioned earlier remain the same. Now we look at some of the extra fields we have to play around with (rubs hands with glee).

How do i get this indicator?

Free version works on AUDUSD, GBPUSD, USDJPY.
(Discount code in email too!)

2 Candlestick Reversal Patterns

There are many 2 candlestick reversal patterns out there. And this is where we can actually start spotting stronger reversal signals. You could even use these 2 candlestick reversal patterns to add a “confirmation” candle to your 1 candlestick reversal patterns.


Anyway, in this section I will show you (and explain in-depth) how we can go about building a 2 candlestick pattern with our indicator and of course, the results in would bring. Prepare to get your mind blown!

The Bullish / Bearish Engulfing Candlestick Pattern

So, one of my favourite reversal patterns is the engulfing candle. Lets first look at the bullish engulfing candle. Here’s a model picture of how a bullish engulfing candle looks like:

Perfect example of the bullish engulfing candle. Take note - for forex, the engulfing candle's body does not need to "gap" down. It can be at the same level as the "close" of the first bearish candle.

The strict definition of this is that the entire body of the second candle needs to cover the first candle. In forex, this is trickier because there are fewer price gaps that would lead to a true bullish/bearish engulfing candle as seen in the equity/indices markets. So how we adjust this indicator to cater to the forex market is through the first candle having to be a fairly strong candle with almost 0 wick/shadow. The second candle (the engulfing candle) will cover the entire body of the candle and in the case of a bullish engulfing candle, we get it to cover the high of candle 1 too (this makes the engulfing effect stronger).

As mentioned in the 1 candlestick reversal patterns above, we will require the bullish engulfing candlestick pattern to be at the bottom of a downtrend (hence the condition we use is the bullish reversal condition). The reason for this is because this is essentially a reversal pattern – meaning it works best following a sustained drop.

Now, even for a supposedly simple 2 candlestick reversal pattern such as the Bullish engulfing pattern, it seems tremendously complex, right? So, using this definition strictly, if we look at what other candlestick indicators show, it is terrible. Here are some examples of what happens when you don’t consider all these important factors like many of the other candlestick indicators out there:

bad examples of engulfing candles
These are bad examples of engulfing candles identified by one of the other candlestick indicators out there. I mean, are they even trying??

These look terrible, right?

Now, why is this so? Well, it’s simple – let me break down the thought process for you on what really goes behind a good bullish engulfing candlestick pattern.

How do we design the perfect bullish engulfing candle?


The Average True Range

We can’t just call any random 2nd candle which has its open and close bigger than the previous 1st candle as a bullish engulfing candle. Why? It’s because engulfing candles are supposed to be strong. Not teeny weeny tiny candles. So by that definition, we need to ensure that they are of a certain minimum size. So, how do we determine this size? Well, through the best adaptive size indicator out there: the Average True Range (ATR). 

Huh? What does this mean?

That means I would put in a requirement that the 2nd candle (the engulfing candle) needs to be bigger than a minimum X*ATR value (with X being a random variable. In this case, we can use 1 so that it’s the size of a normal candle).

Now, what else is required? 

Wicks and Shadow

An engulfing candle should ideally not have too much “wick/shadow” – the less wick/shadow, the more confident the candle is. The entire candlestick should ideally be comprised of 90% body. So I will add in a requirement here that the body should be between 90% – 100% of the entire candle. So this parameter ensures that the engulfing candles I have are nice solid big ones with little wicks/shadows (which are actually signs of indecision).

Okay, so we’ve defined the minimum size of the bullish engulfing candle along with it requiring a nice solid body – what else is needed? 

The “Engulfed” Candle

The next thing needed is we need to define the 1st candle – the “engulfed” candle. This can’t just be any random tiny candle. So what if we have a nice big engulfing candle but the candle it engulfed is a tiny insignificant candle – right? So in this case, we will also similarly define the engulfed candle as a decent-sized candle with a total height of at least Y*ATR. On top of that, the body should comprise at least 90% – 100% of the entire candle.

If we wish to increase the strength of these bullish engulfing candles, we can even have the option where the close of the 2nd candle (the engulfing candle) is not only higher than the open of the 1st candle (the engulfed), but also higher than the highest point (high) of the 1st candle such that it totally 100% engulfs it. This is how it would then look like:

What is the result of this? You get nice awesome bullish engulfing candles such as this:

Normal Bullish Engulfing Candlestick Pattern
The perfect example of a bullish engulfing candlestick pattern.

Indicator settings to detect the perfect bullish engulfing candle pattern:

  • Reversal condition: Bullish
  • Minimum size of 1st candlestick body: 50%
  • Maximum size of 1st candlestick body: 100%
  • Minimum size of 1st candlestick body based on ATR multiplier: 1
  • 1st candlestick type: Bearish
  • Body position in percentage from top: 0 (not relevant)
  • Body position in percentage from bottom: 0 (not relevant)
  • Use 2nd candle: 1 (yes)
  • Minimum size of 2nd candlestick body: 70%
  • Maximum size of 2nd candlestick body: 100%
  • Minimum size of 1st candlestick body based on ATR multiplier: 1
  • 2nd candlestick type: Bullish
  • Body position in percentage from top/bottom: 0 (not relevant)
  • Candle 2’s High > Candle 1’s High: 1 (true)
  • Candle 2’s Low < Candle 1’s Low: 0 (false)
  • Candle 2’s Close > Candle 1’s High: 1 (true)
  • Candle 2’s Close < Candle 1’s Low: 0 (false)
  • Candle 2’s Close < Candle 1’s Open: 0 (false)
  • Candle 2’s Close > Candle 1’s Open: 1 (true)
  • Candle 2’s Close > Candle 1’s Close: 1 (true)
  • Candle 2’s Close < Candle 1’s Close: 0 (false)

We actually had to create a special excel sheet .csv for our indicator to read from because we exceeded the number of parameters an MT4 indicator is able to input. That is how detailed and intense our price action candlestick pattern indicator is!

If you flip the parameters around, you’ll be able to find really nice bearish engulfing candles like the one below:

bearish engulfing candle
Perfect example of a bearish engulfing candle that engulfs the entire previous candle.

Now that you know how much thinking goes into crafting a nice double candlestick reversal pattern, let’s take a look at some of the other trickier (THERE ARE TRICKIER ONES?) double candlestick patterns which our candlestick pattern indicator is capable of detecting.

What are some of the other 2 candlestick reversal patterns you can consider? Here is a list that our indicator includes. Each of them is meticulously calculated to ensure that each time you see a setup on your MT4, it is a valid setup according to the strictest standards.

2 Candlestick Bullish Reversal Patterns

  • Bullish engulfing candle
  • Tweezer bottom 
  • Spinning bottoms

2 Candlestick Bearish Reversal Patterns

  • Bearish engulfing candle
  • Tweezer top
  • Spinning tops

How do i get this indicator?

Free version works on AUDUSD, GBPUSD, USDJPY.
(Discount code in email too!)

How do i Install this?

It's as simple as 1,2,3!

When you download the installation file, there will be 2 files inside the folder. They are:

1. TFA Candlestick Pattern Indicator.ex4
(goes into MQL4 > Indicators)

2. patterns.csv
(goes into MQL4 > Files)

For detailed instructions on how to do this, refer to the additional steps below.

candlestick pattern indicator files
There should be 2 files in your installation folder.

The TFA Candlestick Pattern Indicator.ex4 should be placed in your “indicator” folder. To do this, open MT4 > File > Open Data Folder

How to install the MT4 Support and resistance indicator
Open your data folder on MT4
With the new folder opened, you have to navigate to MQL4 > Indicators > paste the TFA Candlestick Pattern Indicator.ex4 into here.
How to install the MT4 Support and resistance indicator part 2
Place it in the indicator folder

Now, you have to place “patterns.csv” into the correct folder. This folder is located at MQL4 > Files. Just paste it in there.

Important: Do not rename patterns.csv into any other name. Otherwise, the indicator will not be able to find it.

MQL4 > Files Folder
To get here, you just need to click on MT4 > File > Open Data Folder (like you did in the earlier step)

The last thing you have to do is to enable your MT4 to allow expert advisors. On the top of your MT4, there is a button called “AutoTrading”. Ensure that it is green and not red by clicking on it.

This won’t make the indicator trade for you – it’s there because there’s some licensing protection on this indicator.

How to install the MT4 Support and resistance indicator part 3
Enable "AutoTrading". Don't worry, the indicator will not trade for you.

The Story of Desmond Leong

Desmond is your average trader. He started off blowing up 7 (or more.. lost count) accounts amounting to more than 500k, tested over 30 Expert Advisors (EAs) to no success and spent over 10k on stupid useless courses.

Today he runs an award winning trading team and provides market analysis and webinars to some of the largest brokers such as IC Markets, XM, Axi, Tickmill, FXCM, VantageFX, easyMarkets and more.

He now has a simple goal: Creating an army of traders who trade profitably together and keep each other accountable. Guiding them with the most comprehensive no-BS free tutorials so that no one ever needs to go through the pain he went through himself to become a profitable trader.

My Trading Strategy

GET IN TOUCH

TFA GLOBAL Pte Ltd
11 Collyer Quay
The Arcade
#11-05
Singapore 049317

CONTACT US

(t) +65 9336 1245
(e) hq@theforexarmy.com

All rights reserved. All other trademarks appearing on this Website are the property of their respective owners.

© Copyright TFA GLOBAL Pte. Ltd.

RISKS ASSOCIATED WITH FOREX TRADING

Trading in foreign exchange (“Forex”) on margins entails high risk and is not suitable for all investors. Past performance is not an indication of future results. In this case, as well, the high degree of leverage can act both against you and for you. Before you decide to invest in foreign exchange, you should carefully assess your investment objectives, experience, financial possibilities and willingness to take risks. There is a possibility that you will lose your initial investment partially or completely. Therefore, you should not invest any funds that you cannot afford to completely lose in a worst-case scenario. You should also be aware of all the risks associated with foreign exchange trading and contact an independent financial advisor in case of doubt.

Trading Derivatives carries a high level of risk to your capital and you should only trade with money you can afford to lose. Trading Derivatives may not be suitable for all investors, so please ensure that you fully understand the risks involved and seek independent advice if necessary.

Leverage enables traders, using a relatively small amount of money, to take a position that is many times the initial investment. This leverage effect can work both in your favour and to your detriment. The Forex market opens up the possibility to utilize this leverage effect to a high degree; at the same time, however, it also opens up the risk of experiencing high losses. Please trade with caution when you use leverage in trading or investing. Your risk is particularly not limited to the initial investment, but can quickly fall into a negative range in the event of strong movements, meaning you may be obligated to pay far more than your initial wager.