How to draw a fibonacci retracement correctly
There are many ways to draw a Fibonacci retracement, but only one way to draw it correctly.
Fibonacci retracements work really well, but only if they are drawn properly. There are many ways to draw them and I can confidently tell you that the majority of what you find online is wrong, sadly. Today, however, I hope to teach you how to draw a Fibonacci Retracement correctly in order to find key levels to buy and sell from. This is the first step to really unlocking the key to profitable trading in Forex – trust me.
Now, the trick to knowing how to draw Fibonacci Retracements correctly comes from knowing that inherently, they come from chaos theory and have close links to Elliott Wave and Harmonics. We will leave that can of worms unopened as I drill down into the correct ways to look at the swing high and swing low points of the chart where you will be drawing your Fibonacci Retracements from.
What makes me qualified to teach this tough subject?
- Former technical analysis advisor to the largest banks and hedge funds including Goldman Sachs, Brevan Howard, Citibank, and Nomura.
- Currently runs the technical analysis division of the largest brokers including IC Markets, Tickmill, FXCM, Pepperstone, and 10+ more.
- Backed by a team of CMT, CFTe and CFA accredited analysts.
- The Technical Analyst Award: 2019 & 2020 for Best FX Research, 2020 for Best Equity Research
- Master in Elliott Wave and Harmonics (which is where a lot of the Fibonacci tricks come from).
Can you trade full-time just by learning Fibonacci Retracements (and Fibonacci extensions)?
Yes, you can, it is through the art of Fibonacci confluence (lining up multiple Fibonacci levels to find strong areas of support/resistance). This works primarily with a scalping and day trading strategy.
I personally recommend you add these on top of Fibonacci confluence to improve your profitability:
- Support and Resistance (the correct way)
- Proper Trade Management
- True RSI
It all still revolves around the concept of confluence – finding multiple studies that combine well together to determine high probability trading setups.
Here’s a video interview of me (Chief Trader, Desmond Leong) on how I’m able to trade full-time and run an award-winning research firm.
Do you have a video explaining how you trade with Fibonacci Retracements?
Yup! If you prefer to watch videos (versus reading), please go through this video and check it out as I dive deeply into how I use Fibonacci retracements to trade.
Warning: It’s really complicated (but powerful) lol. So please take the time to really master this skill.
Really cool - but do you have one on Fibonacci Extensions too?
I recommend you watch this after you have mastered Fibonacci retracements. But if you feel confident enough, by all means, please watch this video on Fibonacci extensions (which I combine very effectively to trade with Fibonacci retracements).
Can Fibonacci Retracement work in both choppy markets and trending markets?
The short answer to this is: Yes. Fibonacci retracements work well in both choppy (range bound) markets and trending markets. However, one of the most important things you need to take note of is that the structure and the movements have to be clear. What do I mean by that? Take a look at the pictures below.
Unclear market structure:
An example of a chart structure that looks really good is the one below. You can see that you know exactly where are the major swing highs and major swing lows which are crucially important to use when drawing Fibonacci retracements (and extensions).
Clear market structure:
So the first thing to know is that while Fibonacci Retracements can be used in both choppy and trending markets, one of the key things to look out for is a clear market structure.
Adjusting time frames for clearer market structure
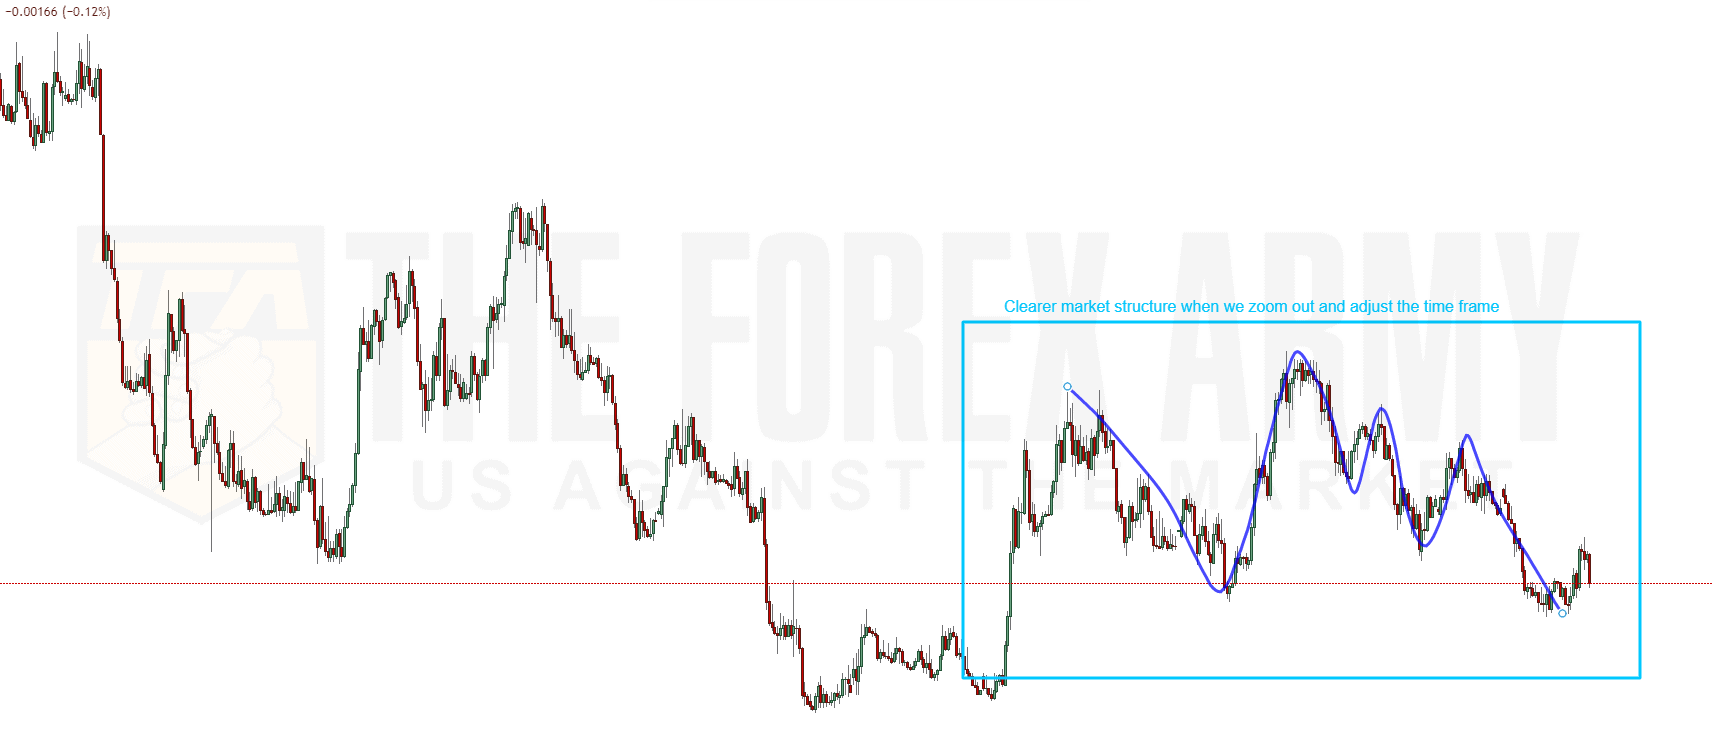
One important thing we can do to find clearer market structures to do our Fibonacci analysis is to adjust the time frames so that the market structure is clearer. What might look messy on an M30 chart might look very clear on an H4 chart.
If there’s too much chaos in the shorter time frames, it does not mean that the entire currency pair is not able to be analyzed at that point of time – it could simply mean that we need to take a step back (or sometimes a step forward) to get a clearer view. Here are some examples of that.
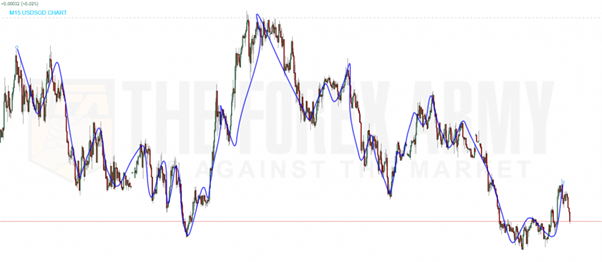
Unclear market structure from M15 view:
Clear market structure from H1 view:
At the very basics, the clearer the swing low, the clearer the swing high and the clearer the “trend” between these 2 points, the more accurate a Fibonacci Retracement will be.
Now, when I say trending market, this doesn’t mean those super long trends that last for months and years. It all depends on the chart time frame you look at. You can be looking at an M15 chart and say “wow this has to be a megatrend!” but when you take a step back and look at it, it is only a chart showing a few days. Any time frame can have a trend, albeit it can be either a short term one or a long term one.
Fibonacci Rule: Trend line MUST Follow Price Structure Closely
Whether you are drawing Fibonacci retracements, projections, extensions or expansions, there is one important rule:
– Your Fibonacci trend line MUST follow price structure clearly.
– Trend line can deviate from price structure, but not by too much.
In the example below – you can see two examples. One follows price closely while the other cuts through price structure.
The trendline can deviate from price structure by a bit, but most of it should follow price structure.

The Fibonacci Retracement Levels That Work (Tried and tested over the years)
Fibonacci Retracement levels between 0% to 100%
- 23.6%
- 38.2%
- 50%
- 61.8%
- 76.4% or 78.6%
- 88%
These are the key Fibonacci retracement levels that work – there is always a huge debate on whether some levels work better vs the others but honestly – the truth is that Fibonacci retracement levels work sometimes – all the time. And that’s the problem.
The trick is to find multiple Fibonacci retracement levels lining up together so that you can increase the probability of a bunch of Fibonacci retracement levels working versus a single Fibonacci retracement level working – This is the definition of Fibonacci confluence.
Now, what I want to do next is to teach you what to look out for when you are about to draw a Fibonacci retracement.
How to draw a Fibonacci retracement correctly: 4 Essential Steps
There are 4 essential steps:
- Is the market structure clear? (Look for big zig zags)
- Identify the recent trend – prices going down or up?
- Identify recent major swing lows and recent major swing highs
- Connect the 2 extreme points – highest to lowest (downtrend), lowest to highest (uptrend)
Now you have Fibonacci retracement lines showing you when you can expect a bounce or a reaction (drop).
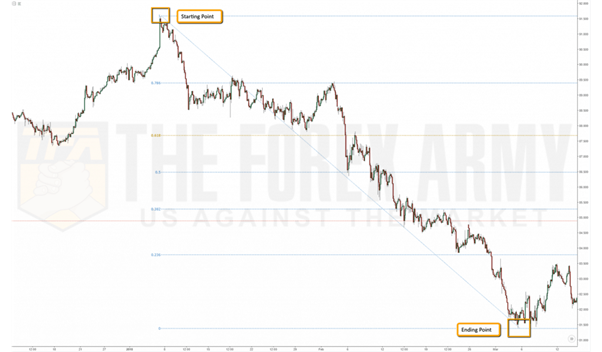
To find key resistance levels: We begin at the highest point and end at the lowest point.
To find key support levels: We begin at the lowest point and end at the highest point.
IMPORTANT: If you are looking for retracements (from 0% to 100% range), your ending points should never have any bars to the right that ‘breaks’ it. So for downtrends with an ending point that is the lowest point of the trend, there should not be any bars that are lower than it. You can better understand it through this illustration :
This is a correct example of taking the highest starting point to the lowest.

When does your Fibonacci Retracement become invalid?
Yes, there are times when your Fibonacci Retracement becomes invalid. One of the most common scenarios of this is when price makes a lower-low (assuming you are drawing a Fibonacci retracement from the top to the bottom like in the picture below).
If there are bars on the right that ‘break’ your ending point, it becomes invalid. Here’s an example :

You can see that you should essentially be taking what I call the ATL (All Time Low) as your ending point if you are drawing a Fibonacci retracement from the top to the bottom (hence finding resistance levels).
Now, there are Fibonacci retracements that are negative (-27%, -61.8%) and we will touch on these as they basically go beyond your endpoint (like the image above) YET they are still valid.
Fibonacci Retracement Levels (0% to -100%)
- -27.2%
- -61.8%
These are the Fibonacci retracement levels you can consider in the negative retracement zone which are useful. All the rest I found to be quite useless.
Now, this is how a negative Fibonacci retracement looks like (along with the normal range 0-100% and positive range >100%):

What you immediately notice is that -27.2% and -61.8% is below the ending point so price could technically continue to drop from here and the Fibonacci retracement would still be valid (but the normal range from 0-100% won’t be valid once price goes beyond the ending point).
“Wow, that’s freaking confusing. Can you explain it a bit more?”
Definitely, reading it myself, I still get confused.
The negative Fibonacci retracements are most useful when price reversed up to about the 50% to 78.6% range before continuing to drop. It is NOT effective if it only retraces up to 38.2% (like in the picture above) before it drops beyond the ending point. Let me show you an example of what is a really nice negative Fibonacci retracement.
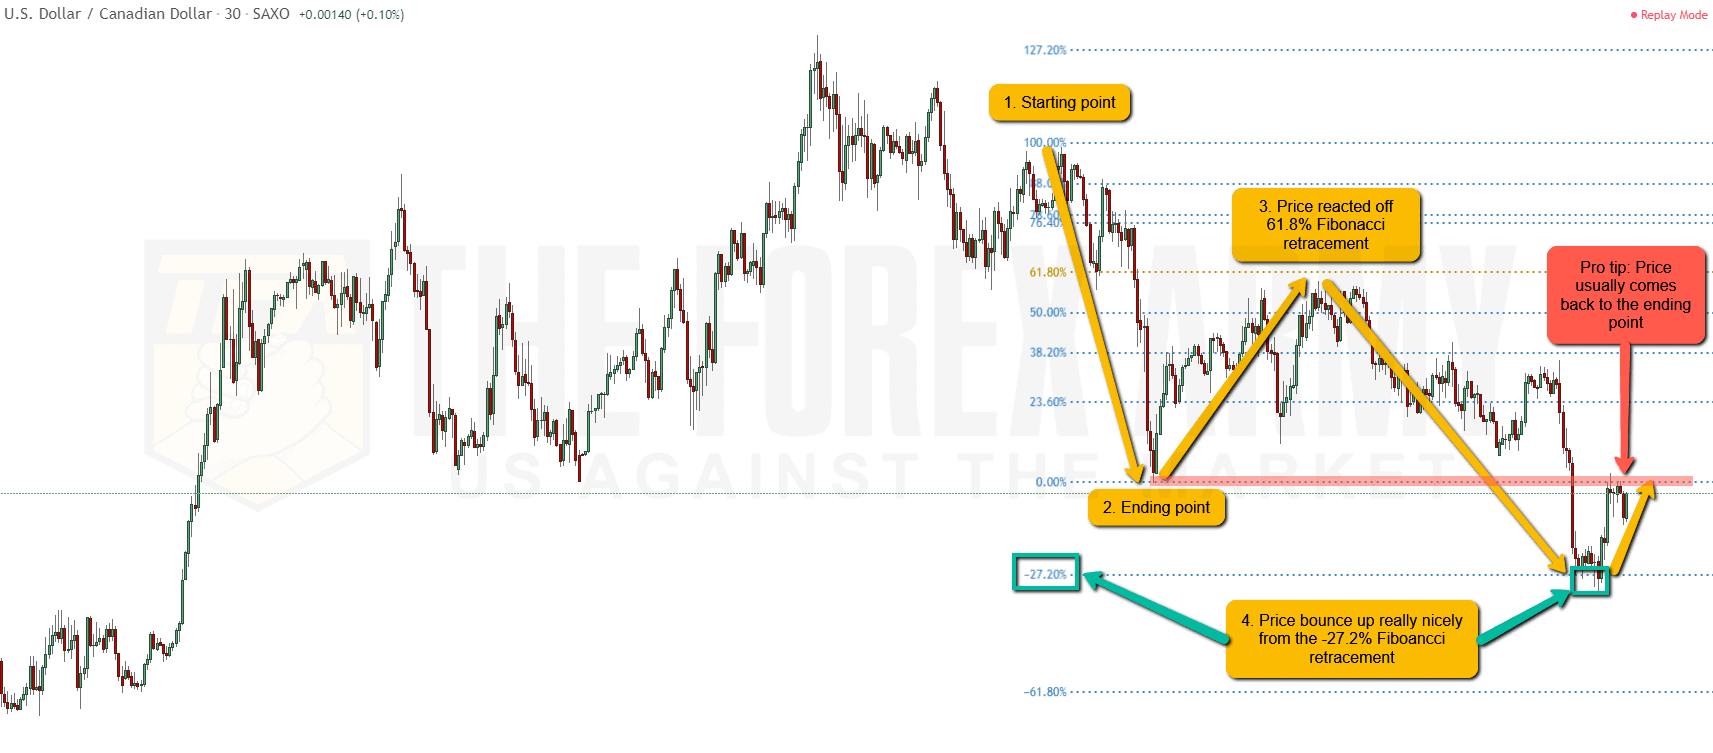
Part 1: This is how you draw a negative Fibonacci retracement that first reacts off the 61.8% Fibonacci retracement before dropping beyond point 2 (the ending point).

Part 2: You can see how price drops really nicely to the -27.2% Fibonacci retracement level where it bounces up.
Pro tip: Price tends to make a bounce back up to the ending point which is a pullback resistance level (we have an indicator for that).
So the key thing you should take note of is to watch out for the -27.2% Fibonacci retracement and -61.8% Fibonacci retracement. These are particularly useful when you line them up with bigger Fibonacci retracements and even Fibonacci extensions.
Pro tip:
Look for a “Flash” zigzag when identifying these fibonacci expansions.
Explanation:
Refer to the gif before. The clearer the movement of the “Flash” zigzag, the better. We ideally need to wait for prices to retrace at least 50% in point (3) before taking off in the other direction (also preferably in a straight line movement).
Is a Fibonacci Retracement enough to trade profitably?
Short answer: No
The simple fact is: YOU WILL ALWAYS FIND FIBONACCI RETRACEMENT LEVELS.
Imagine using the example above, I told you to sell when price reaches the 23%, then the 38%, then the 50%, followed by the 61.8%, then the 78.6% and on and on and on. What’s going to happen at the end of that? Well, you would have lost a lot of money and probably be spending a bit more money to buy that next plane ticket to find me and kick my teeth in (which I really do not wish to happen).
The trick to trading Fibonacci retracements profitably is in using them in conjunction with other Fibonacci levels. This includes other Fibonacci retracements from a bigger/shorter trend, using Fibonacci extensions (we will cover this), using support and resistance (correctly), identifying the True RSI areas and also price action. What this results in is you increase your odds tremendously on getting into profitable trade setups.
Essentially, you are trading something called Fibonacci Confluence which is where the beauty of chaos theory comes in.
Do you provide Fibonacci Confluence trading signals?
So i’m adding in this section here because a lot of people are asking if I can provide Fibonacci Confluence trading signals so they can better understand how to trade this amazing strategy through examples.
If you’d like to get such signals for free, please pop in your details below to join my free mailing list 🙂
Fibonacci Confluence trading signals
The good stuff 😉
How to combine Multiple Fibonacci Retracements to create Fibonacci Confluence?
Fibonacci Confluence is essentially combining multiple Fibonacci levels (can be retracements or extensions) to find clusters where these Fibonacci levels congregate. The area where they congregate would pose a strong level to play a trade from.
Usually, when people trade Fibonacci, they are “contrarian” traders, meaning they are looking to play the bounce/reaction in the other direction. What this means, in other words, is if price is dropping, I am looking for a level to buy from. If price is rising strongly, I am looking for a level to sell from.
Now, when you try to do Fibonacci Confluence, you’ll need to ensure you really know how to draw Fibonacci properly because you are multiplying the chances of you drawing it wrongly (and hence trading wrongly and losing money) as you draw more and more Fibonacci retracements to get that confluence.
My general rule of thumb is that I try to find at least 3 Fibonacci levels to call it a cluster. This can be in the form of:
- 3 x Fibonacci Retracements
- 2 x Fibonacci Retracements + 1 x Fibonacci Extension
- 1 x Fibonacci Retracement + 2 x Fibonacci Extensions
I rarely go for 3 x Fibonacci extensions. Let’s go through some examples of this.
Combining 3 Fibonacci Retracement levels
As you can see in the picture below, price went down to touch this strong area of Fibonacci confluence support and bounced nicely.
Combining 1 x Fibonacci Retracements + 2 x Fibonacci Extension
I find it much easier to find 1 x Fibonacci Retracements and 2 x Fibonacci extension. This also happens to be my favorite style of finding Fibonacci confluence levels. I will teach the topic on identifying Fibonacci extensions in a separate tutorial but the gist of it is that you need to find the starting, middle and ending point (versus just starting and ending for Fibonacci retracement).
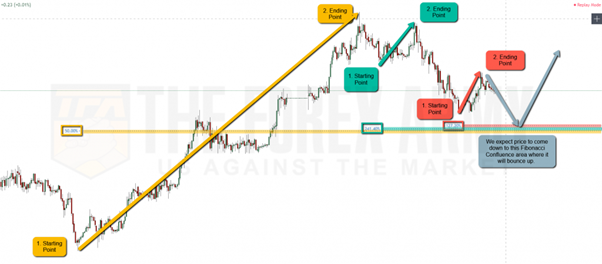
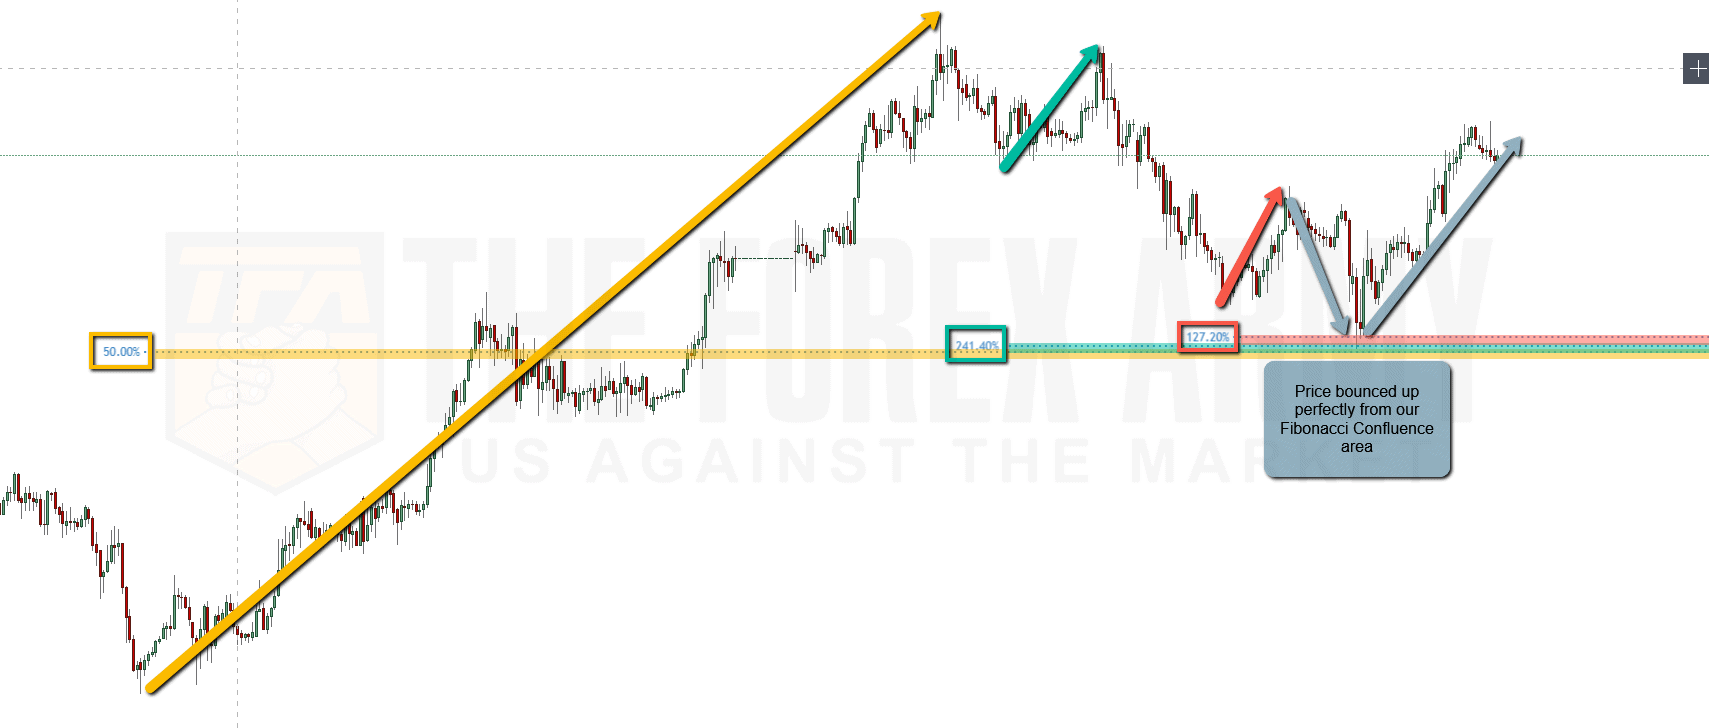
In the example below, we can see how we combined 2 Fibonacci extensions (orange and red) along with 1 Fibonacci retracement (teal) to find a strong area of Fibonacci confluence to trade from. What I would do is wait for price to make a push up to that area and when it touches, I would short the market (sell) and play the drop.

Here is what happens when the market touches this strong area of Fibonacci confluence.

Fibonacci Confluence Trading Strategy
So now that you understand (partially or fully) how Fibonacci confluence works, how do you implement that into your trading strategy?
There are a couple of ways to do this. They mainly revolve around improving your entries, your stop loss, and your take profit placements.
Improving your trade management with Fibonacci Confluence
There is one thing you need to know about stop loss and take profit placement:
- Stop-loss = Beyond
- Take profit = Before
Stop-loss = beyond means you should always put your stop loss beyond a key Fibonacci confluence area. The reason for this is because more often than not, price is attracted to such strong areas of Fibonacci confluence and if your stop-loss is right before (instead of beyond) it, you will most likely get stopped out before the market reverses. This is one of the reasons most people wonder why they got stopped- out right when the market starts to reverse (and they start complaining about stop hunting).
Take profit = before means that you should always put your take profit target before a key Fibonacci confluence area. The reason for this is because when price reaches the Fibonacci confluence area, there’s a high chance that it will not be able to go beyond it, and instead of reaching your profit target, it reverses back to your entry (or even worse, your stop loss!). This is also one of the reasons why people complain that the market is being manipulated because they miss their TP (take profit) by 1 pip.

So now that you know how you can use Fibonacci confluence areas to improve your stop loss and take profit placement, the next thing you can consider is how you can use Support and Resistance to improve your entries.
Improving your Fibonacci Confluence entries with Support and Resistance
This is one of my favorite trading strategies – combining support and resistance with Fibonacci Confluence. This leads to super high probability setups. I kid you not.
So imagine this: You already found a strong area of Fibonacci Confluence to take a trade from. If you combined it with Support and Resistance, wouldn’t it be much stronger?
Now, if you’re using MT4 (MetaTrader 4), we have developed the best MT4 support and resistance indicator out there. It’s even ranked number 1 on google and youtube. Go and check it out to get a deeper understanding of what proper support and resistance is all about.
Below is an example of how we combined these:
- Pullback resistance (learned in the support and resistance page I mentioned above)
- 2 x Fibonacci retracement
- 1 x Fibonacci extension
What this resulted in was a super-strong confluence area for us to play a short trade from.
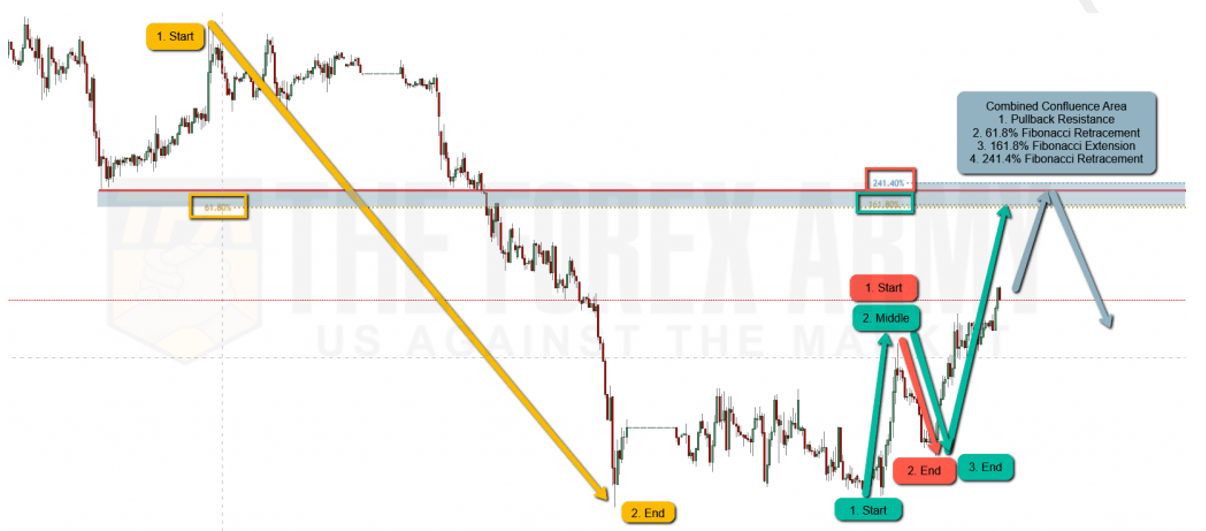

As you can see, price reversed right on the dot – that is the power of combining Fibonacci confluence with support and resistance.
How else can I trade better?
Well, now that I’ve shared with you some of the really amazing trading strategies you can use with Fibonacci retracements, I recommend you expand your knowledge further and learn additional methods you can use to combine with Fibonacci retracements. I will break this down into core and supplementary methods.
Core methods are the foundation of each strategy and are the most important.
Supplementary methods are like nice add-ons you can have to improve the probability of your trading.
Core Methods:
- Fibonacci Extensions
- Support and Resistance (the correct way)
- True RSI (super important)
- Price Action
Supplementary Methods:
- Hidden Stochastic Levels
- Hidden RSI Levels
- Natural Moving Average
- Market Correlation
I have not written tutorials for all these yet (but am in the process of). At the very basic, just learn the core ones first.
If you found this tutorial useful, please help me share it around so more people can learn about Fibonacci retracements correctly (which would lead to our strategies being more effective – more on that in another chapter lol).